In talking about how much substitute teachers make, I noted that the 2012 daily pay rate (at least around here), when expressed in hourly terms, was flirting with the current minimum wage rate of $7.25/hour. This got me to thinking about how the minimum wage has changed over time.
With that as my inspiration, I decided to crunch some numbers and chart the data. I started by hitting up the DOL for a listing of the historical minimum wage rates. I then plugged the numbers into the BLS inflation calculator to get inflation adjusted values (in 2012 dollars). Links to the data sources are at the end of this article.
Origin of the minimum wage
For background, the federal minimum wage was enacted during the Roosevelt administration in 1938 under the Fair Labor Standards Act. At the time, employers were required to pay a minimum of $0.25/hour, which works out to $4.06/hour in inflation-adjusted (2012) dollars.
Note that 45 states have minimum wage laws of their own. When the state and federal rates differ, the higher value applies. In 19 states (plus Washington DC), the state rate is higher than the federal rate. In 22 states, the state rate matches the federal rate. And in 4 states (plus Puerto Rico), the state rate is lower than the federal rate (and thus doesn’t apply).
History of the minimum wage
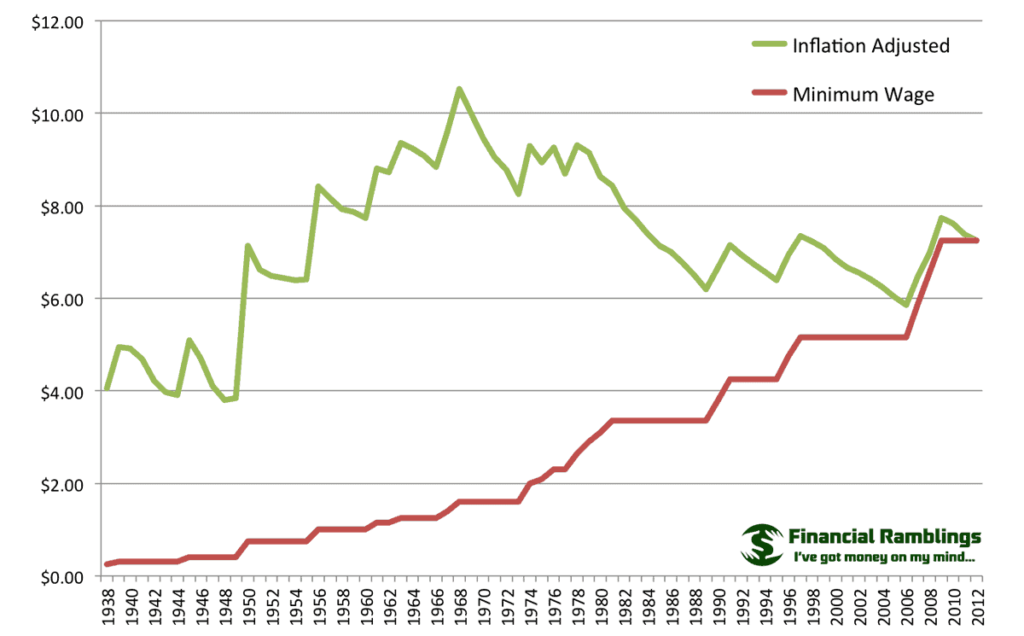
Here’s a chart showing the nominal and inflation-adjusted minimum wage rates from 1938 to 2012:

Some notes:
- Since 1938, we’ve averaged 3.27 years/increase (up to the 2009 increase)
- From 1973-1981 there were seven increases, more than doubling the minimum wage (in nominal terms)
- The two longest periods without an increase were between 1981-1989 (8 years) and 1997-2006 (9 years)
- The minimum wage bottomed out at $3.80/hour (inflation adjusted) in 1948
- The minimum wage topped out at $10.53/hour (inflation adjusted) in 1968
- We’re currently above the (inflation-adjusted) historical average of $7.16/hour
Of particular interest (at least to me) was the period from 1978-1981 when the minimum wage rate increased every year and yet the buying power of an hour of work decreased each year. High inflation sucks.
Here’s something else to consider…
Minimum wage vs. poverty level
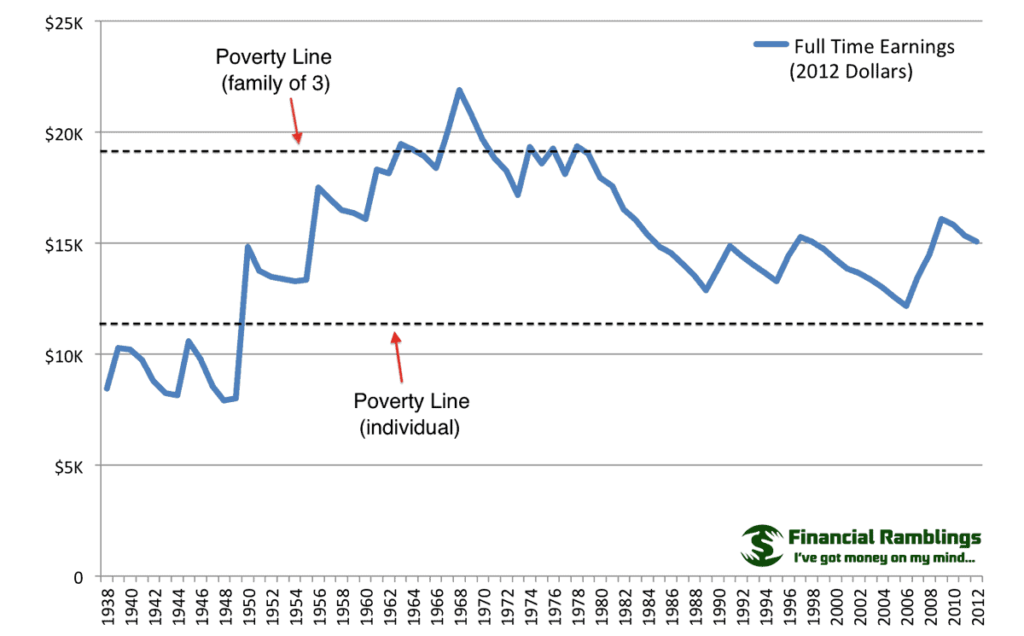
The official 2012 poverty threshold was$11,170 for an individual and $19,090 for a family of three (e.g., a single parent raising two kids). Thus, I decided to make a chart depicting the full-time income (in 2012 dollars) of an individual working full time (2080 hours/year) vs. the individual and family-of-three poverty thresholds.
Here it is:

As you can see, a full-time minimum wage job has been enough to keep an individual above the poverty line from 1950 onward, but a family of three with one full-time (minimum wage) worker was only able to stay above the poverty for a smattering of years between 1964-1978.